GIS Portfolio

Colton Hash

Artist Website:     www.coltonhash.com
Artist Instagram: @colton.hash

Overview

I am an early career GIS Technician with specialized skills relating to landscape data visualization and digital media creation. I am seeking employment as a GIS professional to apply my interests in data analysis, processing and visualization for an organization focused on ecological restoration. Although my educational pathway is unique, I am a fast learner and I understand the theoretical and technical foundations of GIS software. As a bonus, I am a highly capable creative who is empowered to use digital media for impactful public communication.

GIS Analysis Microcredentials, Seneca Polytechnic, Toronto ON
Sept 2023 – March 2024

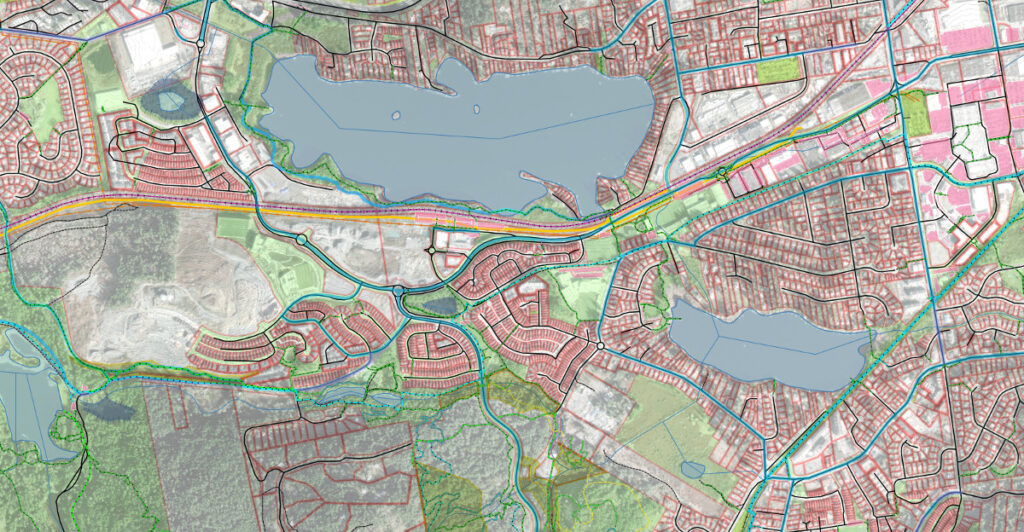
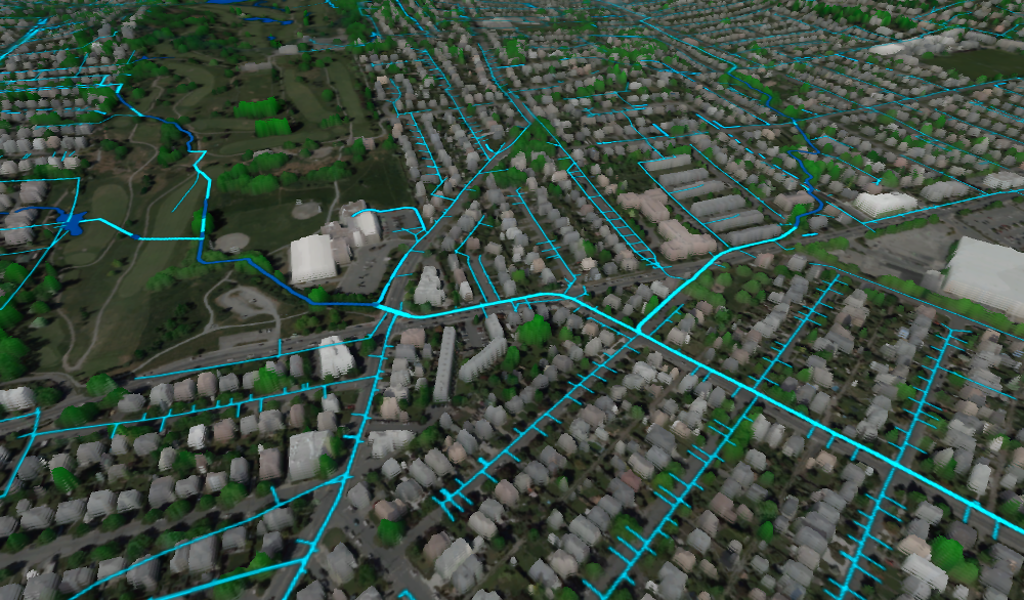
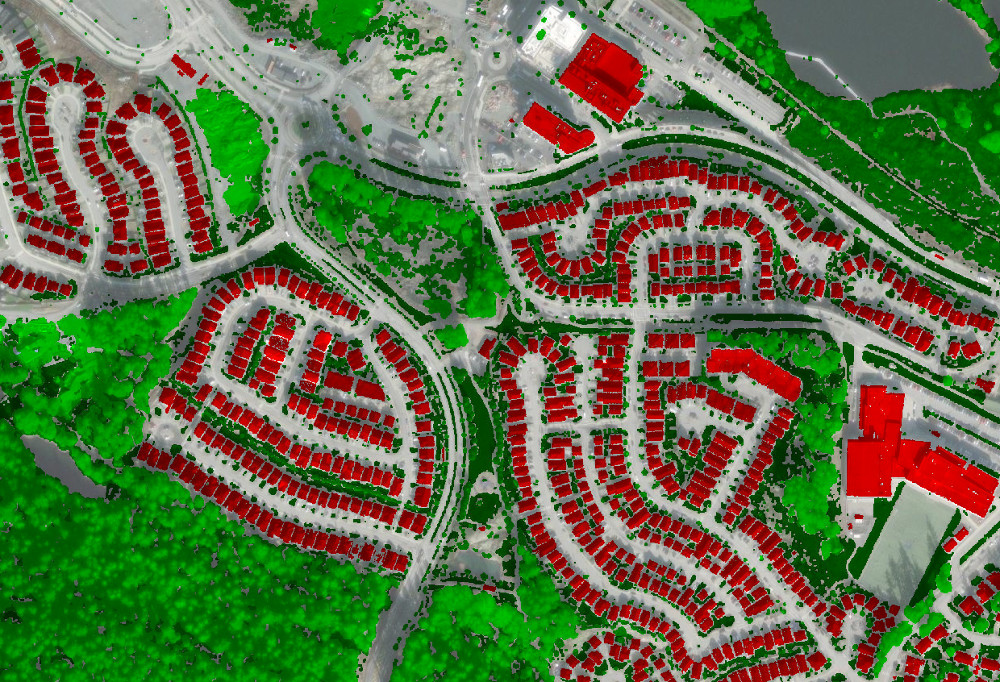
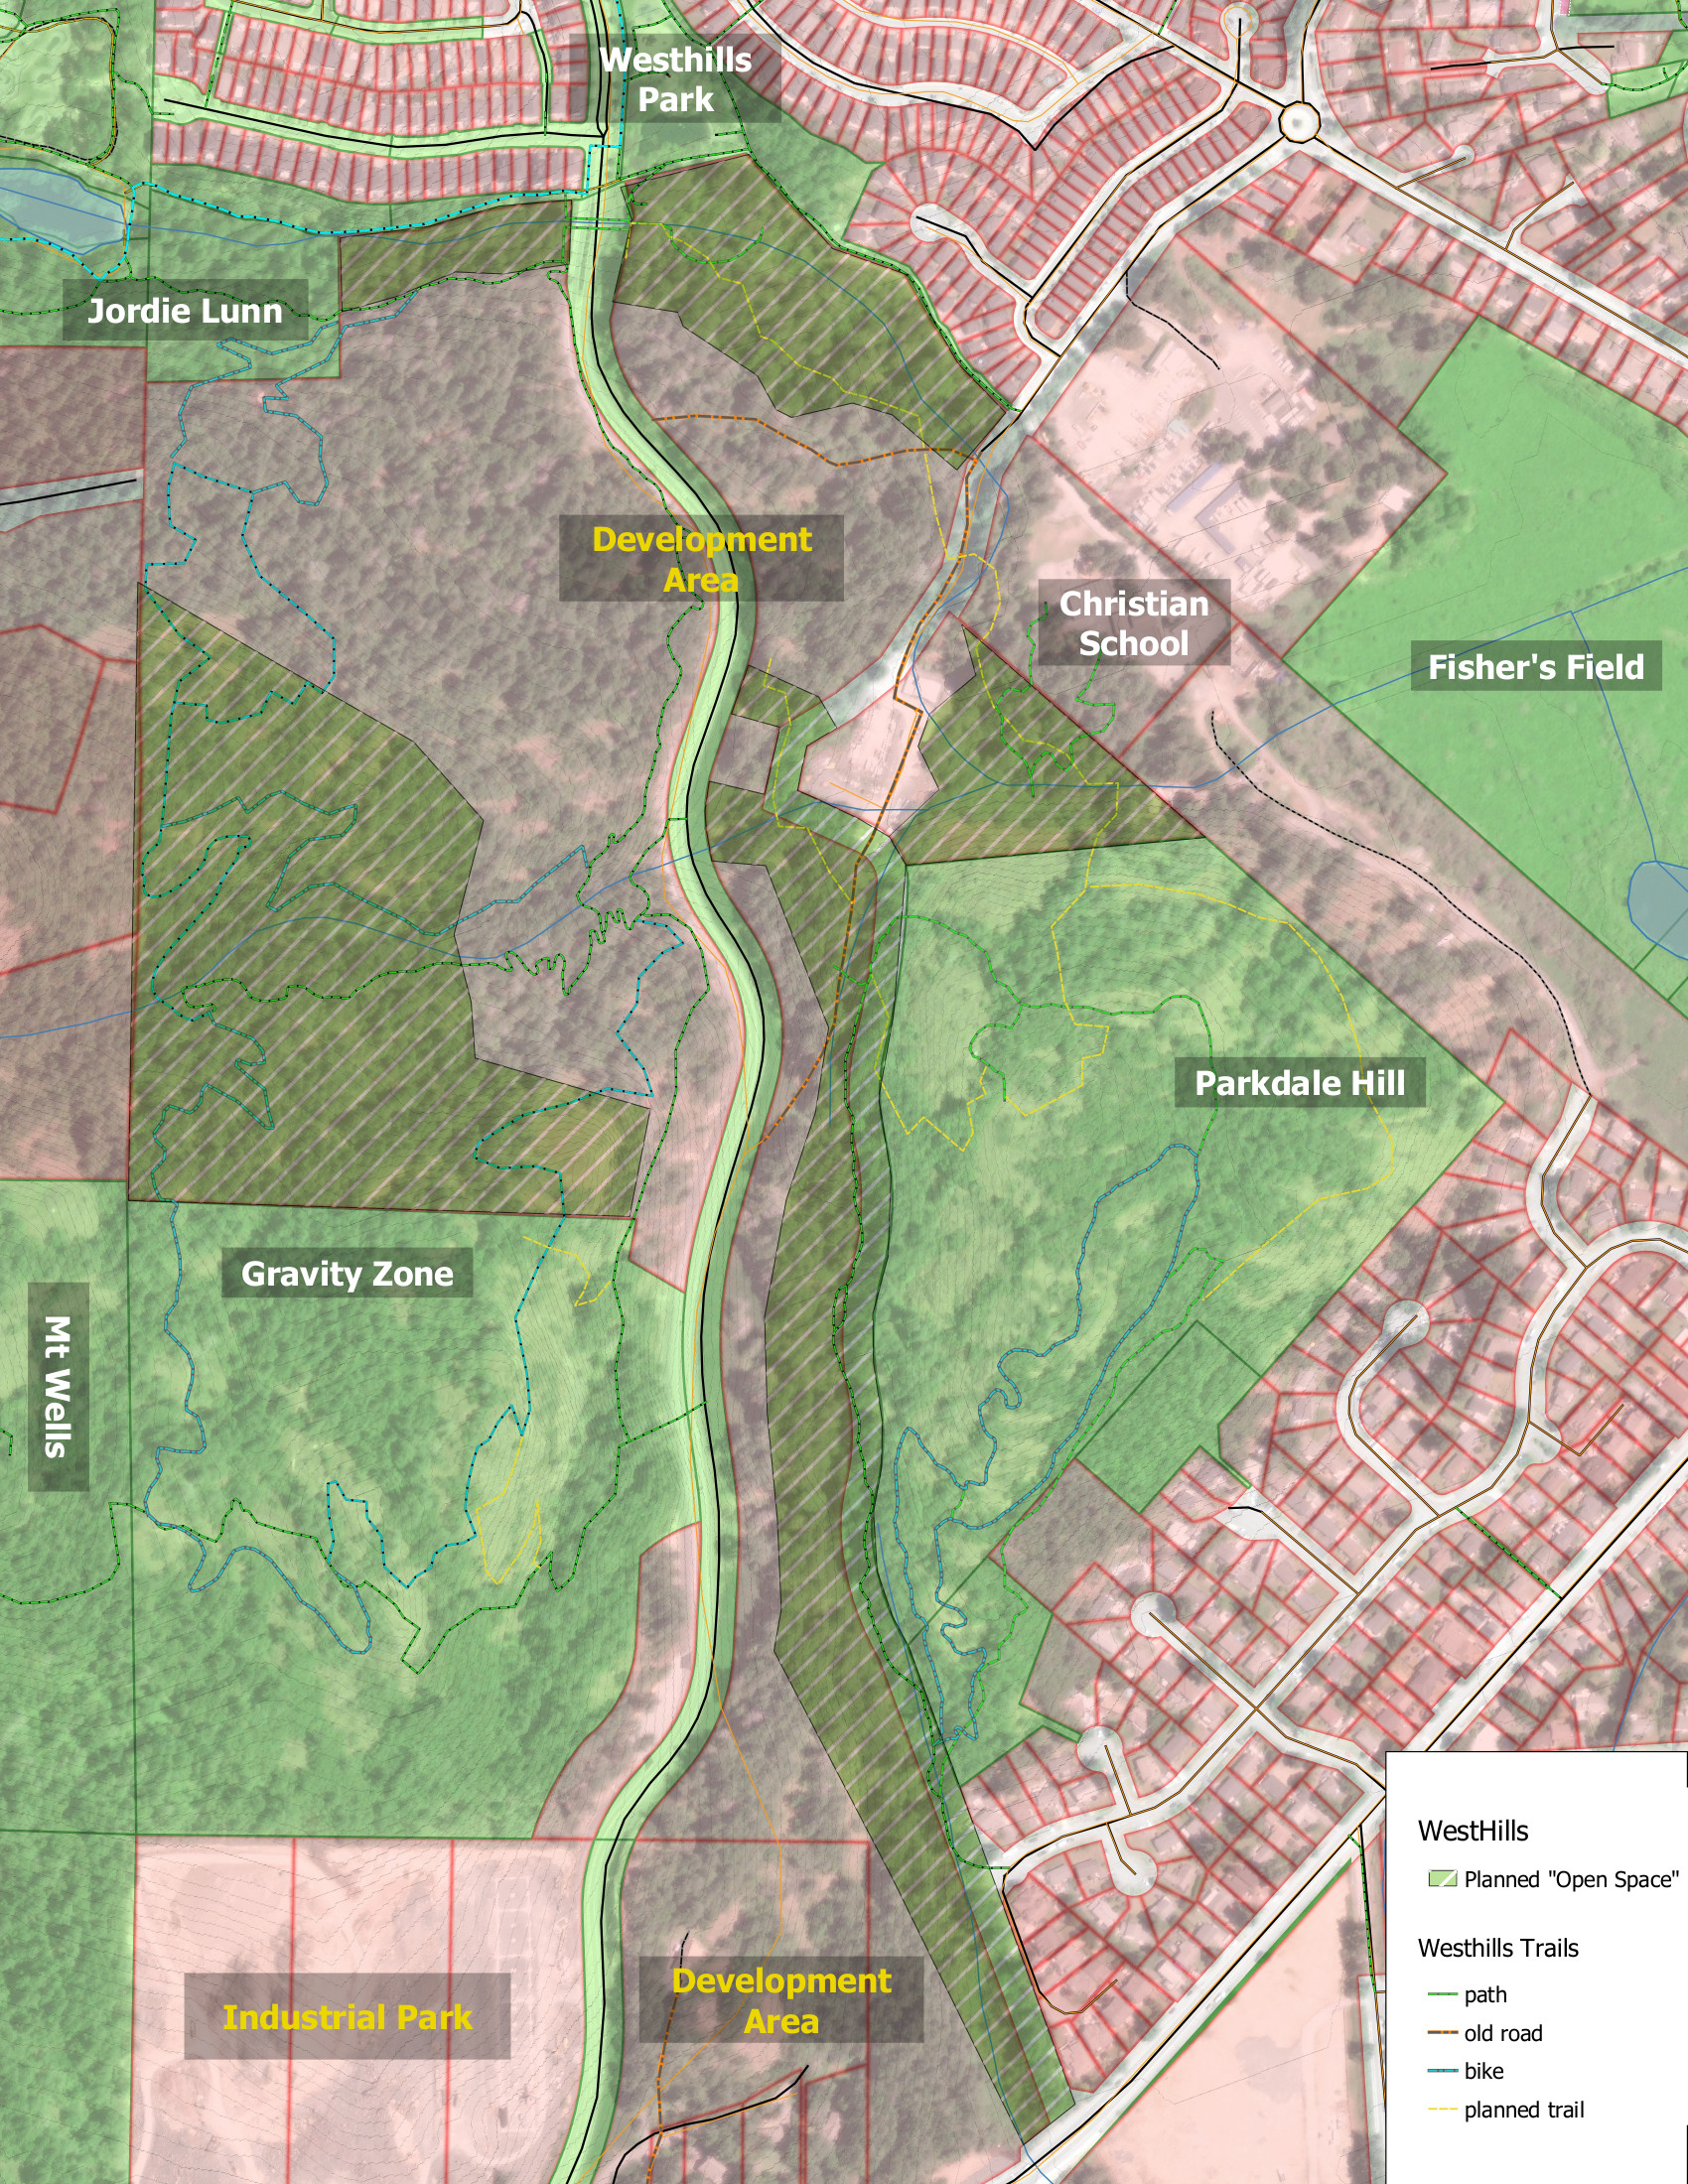
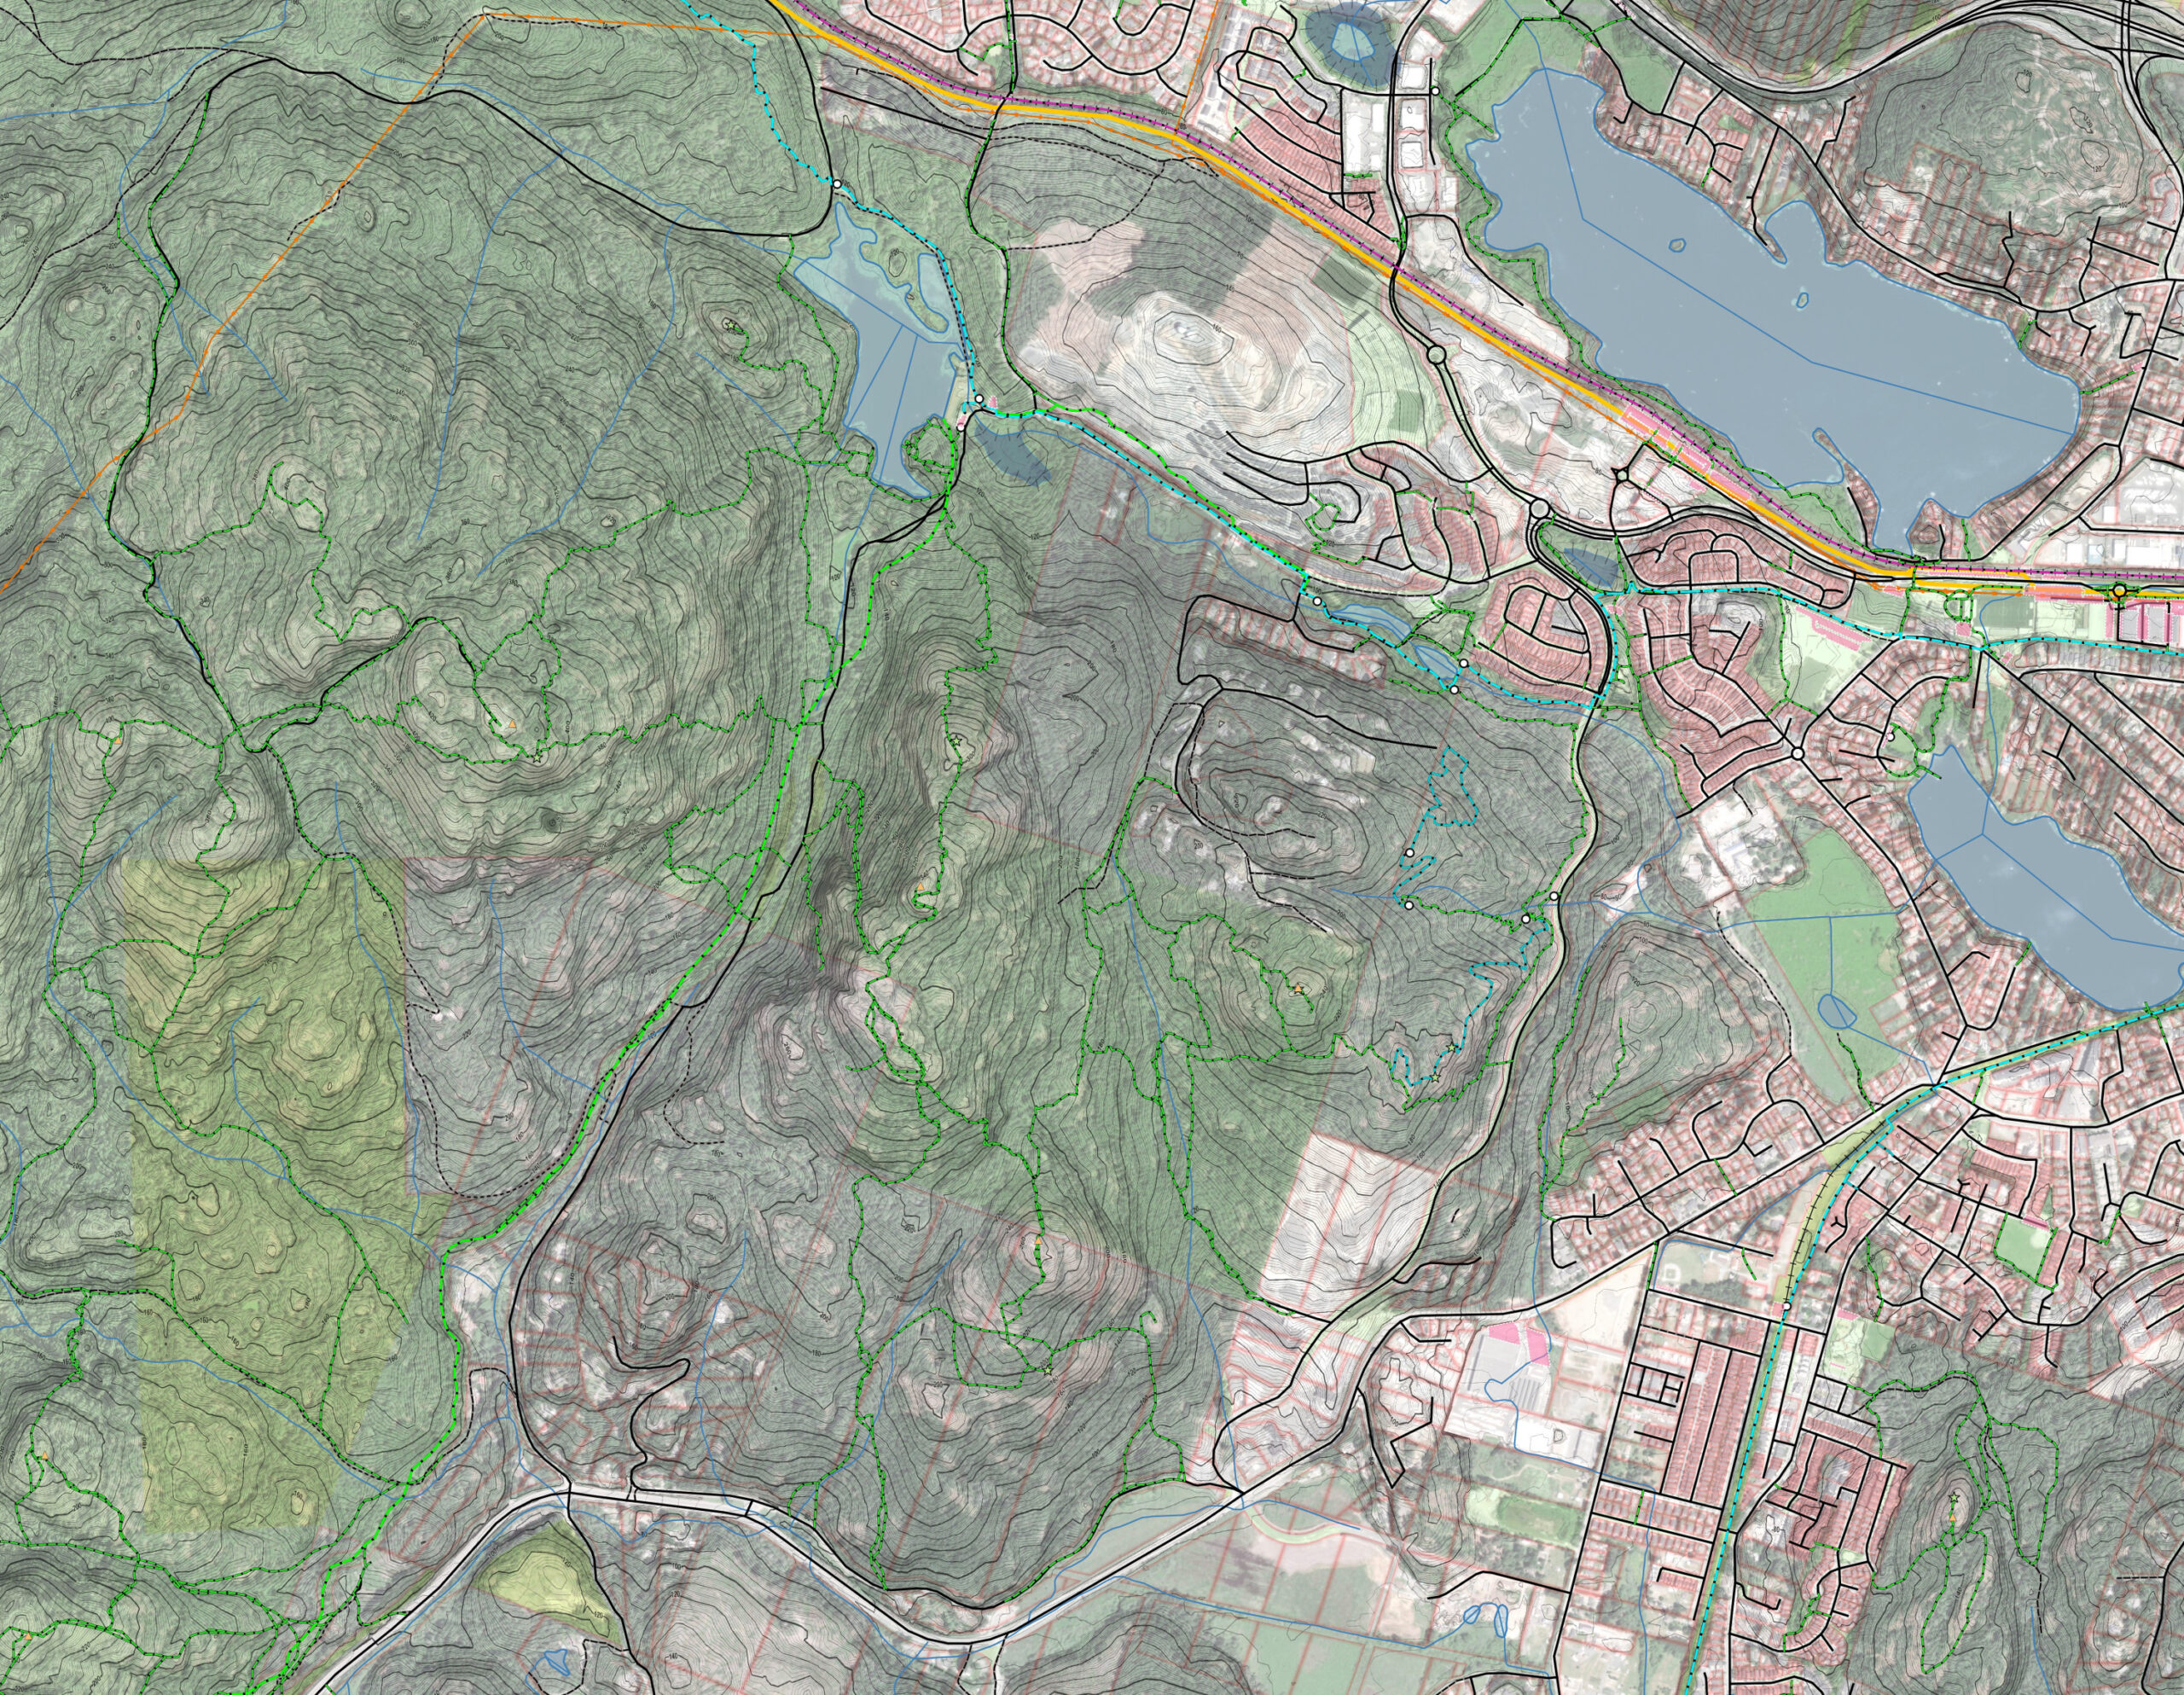
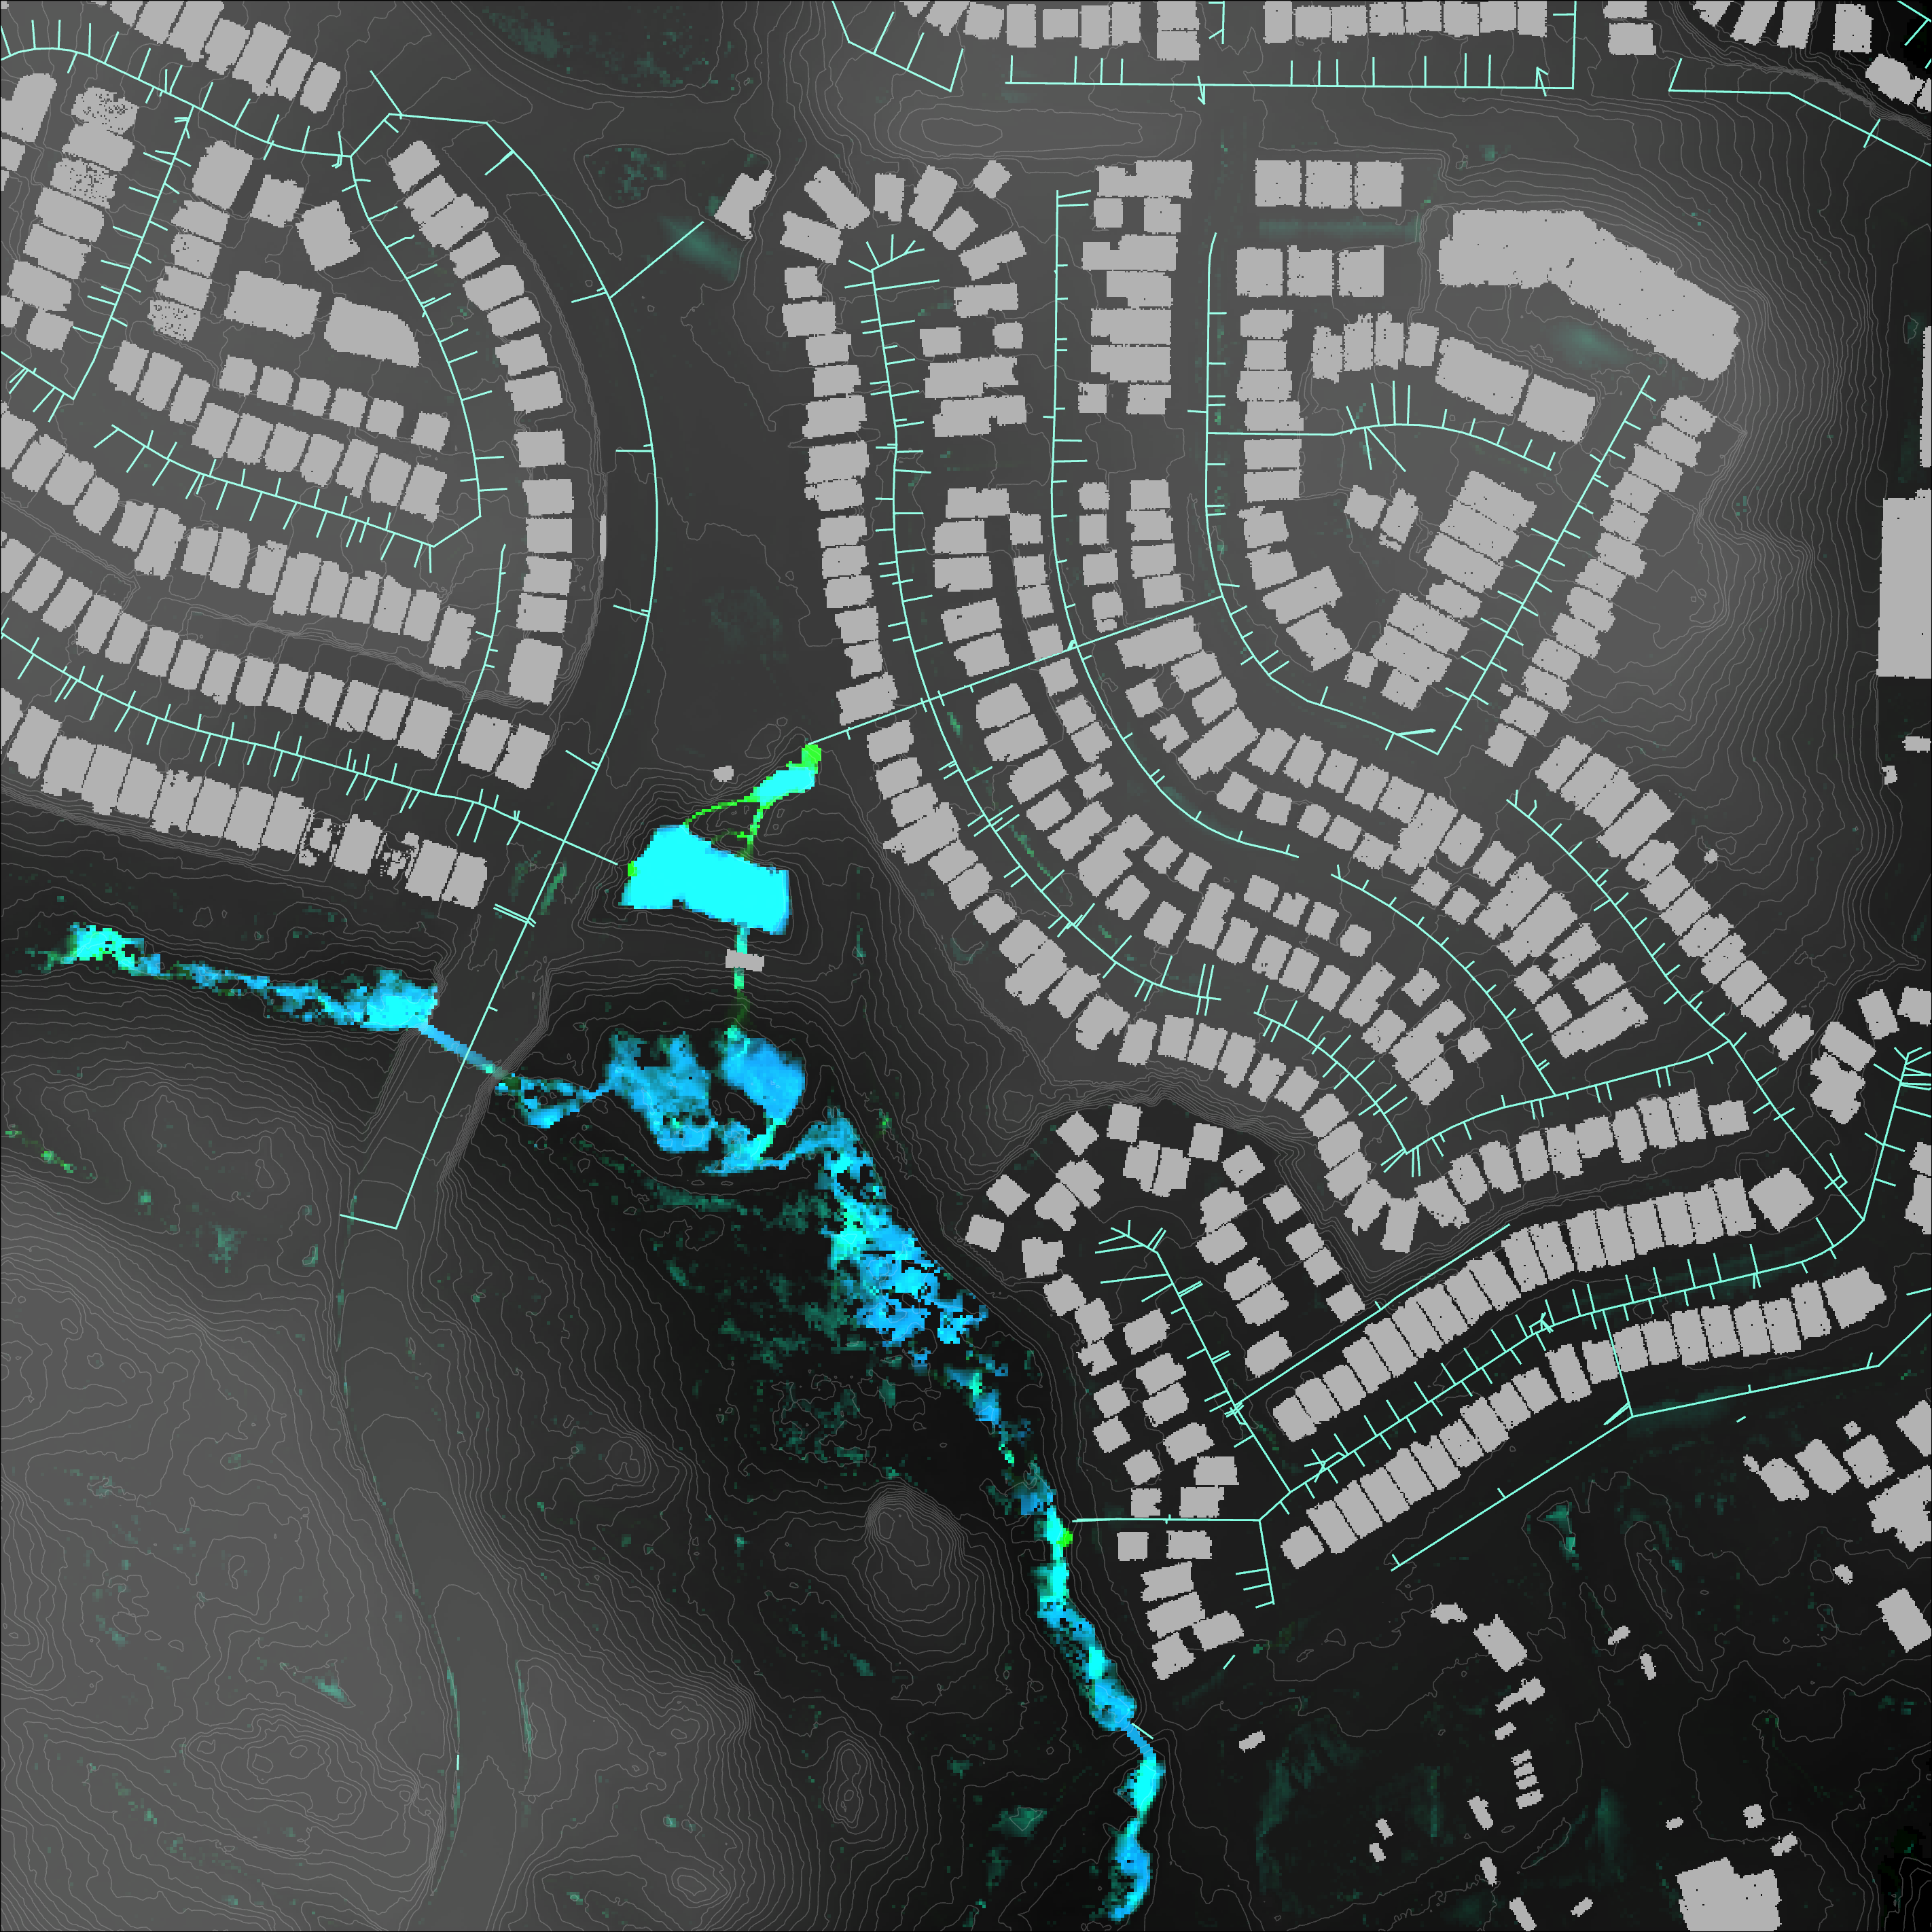
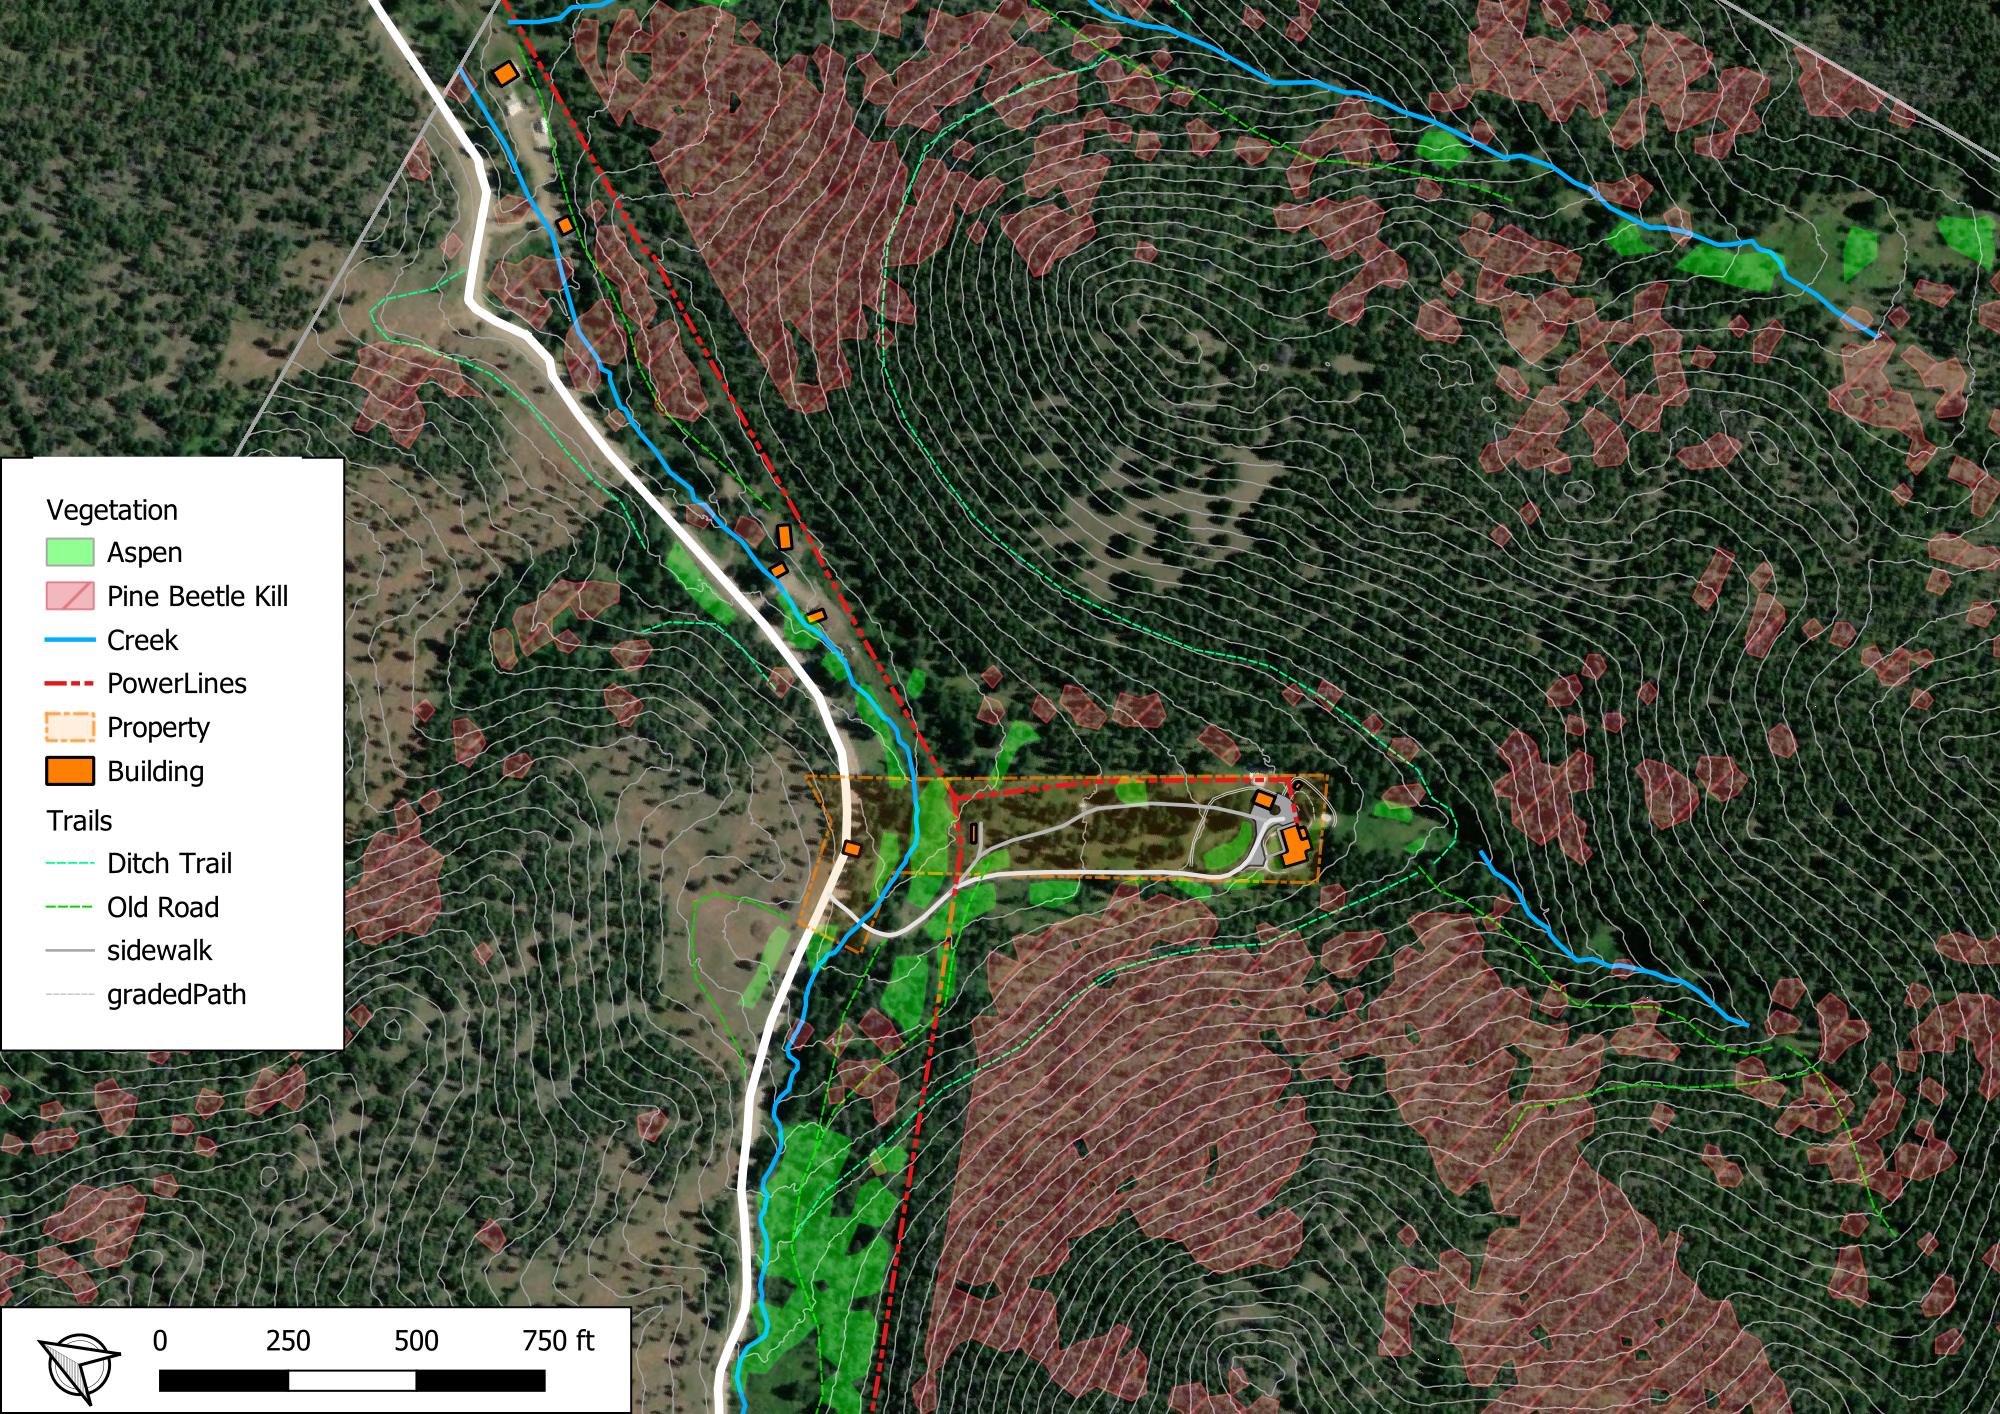
  • ArcGIS Pro vector and raster data analysis, LiDAR data processing.
  • ArcGIS Online tools, exporting for Web Maps and Story Maps.


Master of Fine Arts, Department of Visual Arts, University of Victoria, Victoria, BC
Sept 2020 – April 2022

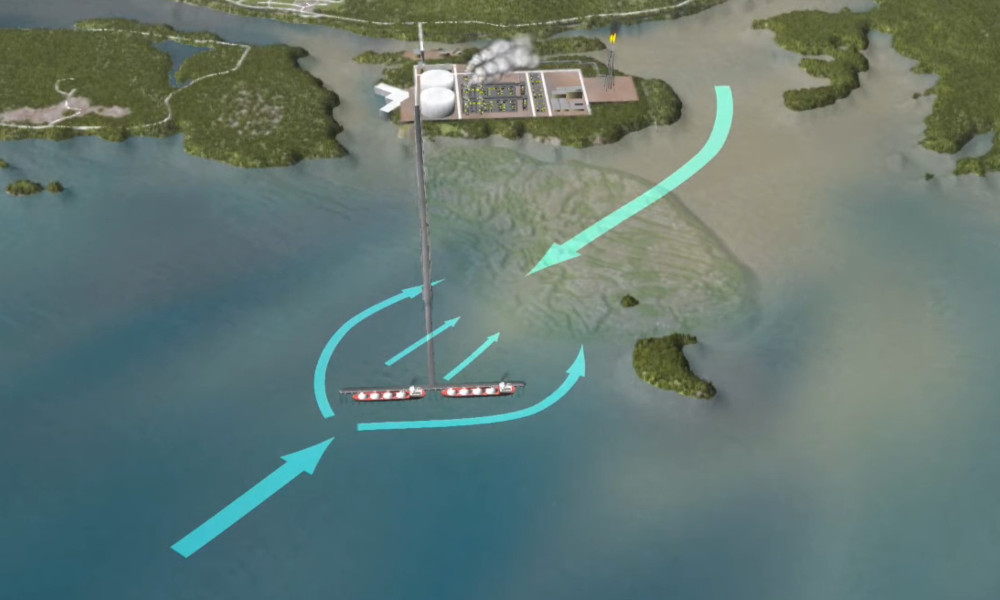
  • Research focus in landscape data visualization and artistic simulation


B.Sc., Combined Computer Science and Visual Arts Major
Environmental Studies Minor, University of Victoria, Victoria, BC
Sept 2010 – April 2018

  • Computer Graphics, Database Systems, Networking, Software Engineering
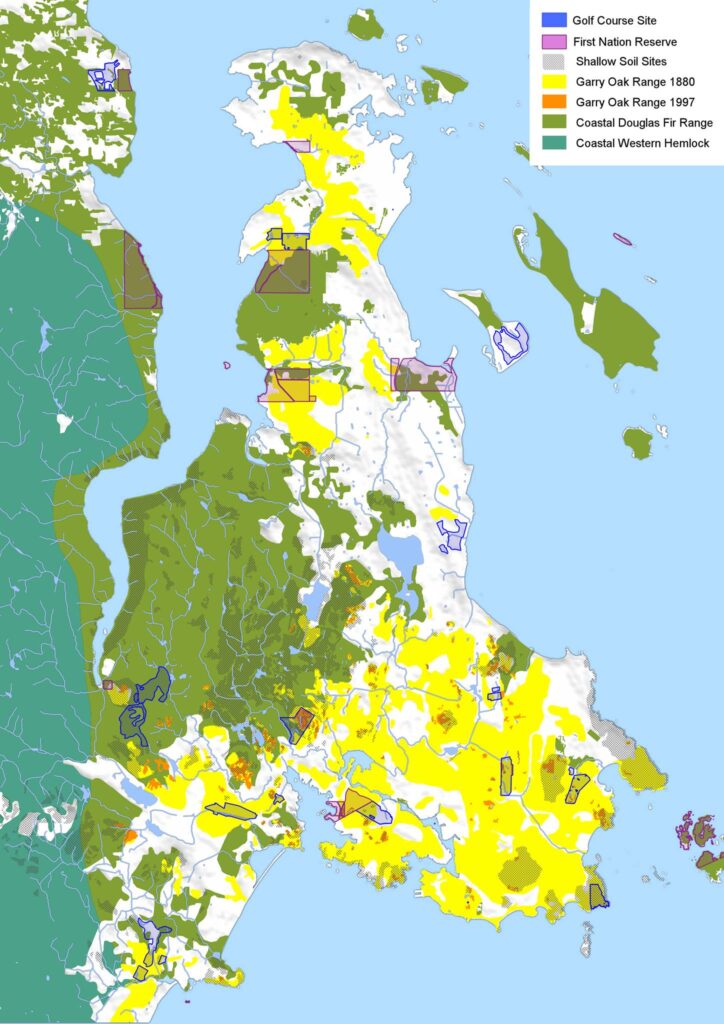
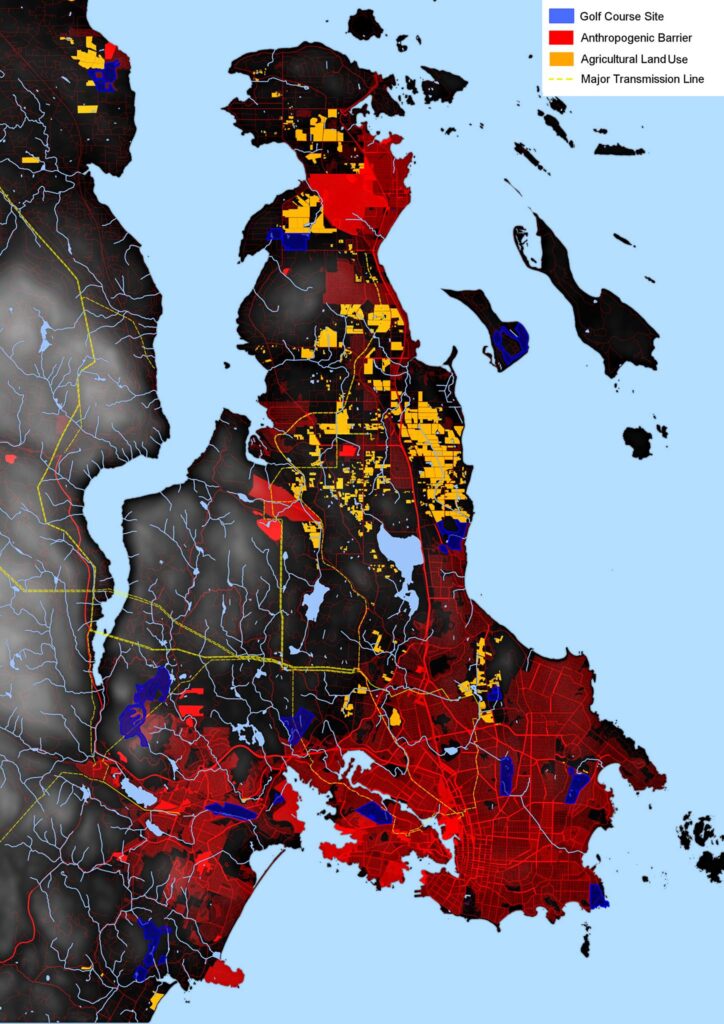
  • Ecological Processes, Ethnoecology, Political Ecology, Systems Theory, Marine Science

GIS Software

  • ArcGIS Pro, ArcGIS Online Tools
  • QGIS, Avenza

GIS Skills

  • LiDAR classification and analysis
  • Database management
  • Model Builder, scripted toolchains
  • Creating new data from remote sensing and field surveying
  • Accessing and integrating government data sources
  • Exporting GIS data for web and interactive applications
  • Exporting maps for print and digital pdf maps for navigation

Web Development

  • HTML, CSS, javascript
  • Google Earth Engine
  • WordPress with Elementor
  • three.js, WebGL

Computer Programming

  • C# with Unity
  • python, java, C

Adobe Creative Suite

  • Photoshop, Illustrator, Indesign
  • After Effects, Premier Pro

Microsoft Office Suite

Google Online Tools

Freelance GIS Projects

These data visualization projects were completed under freelance contracts to produce digital content for public dissemination. Each project involved accessing and composing various data sources for diverse digital platforms. With a background in creating interactive artworks and social media content for environmental advocacy organizations, I strive to create highly detailed graphics that are imapctful and informative.

Urban Watersheds

Engage with Nature Based Solutions

In 2023, I was commissioned to produce an artwork that engages the general public with nature based solutions to mitigate climate change. My final data visualization artwork, Urban Watersheds: Bowker Creek, integrated LiDAR data with municipal storm water system data to highlight how impervious surfaces contribute to polution. This interactive artwork was paired with Hydrosheds, a generative simulation that depicts how changes in urban surface conditions impact local waterways. You can learn more about these projects and the resulting public exhibition at Engage with Nature Based Solutions.

Synoptic Translations Exhibition

Harcourt House

In 2022, I was selected to produce a solo exhibition at Harcourt House Artist-run-centre in Edmonton, Alberta. This exhibition involved the creation of two new data visualization artworks that depict GIS data related to climate change and resource extraction industries. Eye of the Anthropocene was an interactive map which integrated a decade of NASA wildfire data with petroleum infrastructure data. Carbon Pulse was an interactive artwork that depicted greenhouse gas emissions from the Edmonton region.You can learn more about this exhibition on the Harcourt House Website.

Ecosystem Map Animations

Endangered Ecosystem Alliance

In 2021, I was hired to produce a series of map animations depicting Bio Ecological Climate Zones for various ecosystems across Canada. Although these graphics are fairly simple, I wanted to show the complexity of forest cover and terrain, so I produced very high resolution images were animated with Adobe After Effects. You can see my work in the mini documentary videos by the Endangered Ecosystem Alliance.

Fractured Waves Exhibition

Artcite Inc.

In 2020, I was selected to produce a solo exhibition at Artcite Inc, an artist-run-centre in Windsor, Ontario. Due to COVID-19, the exhibition was shifted to an online format, which I wanted to use as an opportunity to experiment with interactive data visualization. The main artworks featured in this exhibition depict greenhouse gas emissions animated with climate model data for the Vancouver and Windsor regions. As viewers zoom into these artworks, they also see a visualization of AIS data to depict aquatic noise pollution. You can see an archived version of this virtual data art exhibition here.

Lelu Island Impacts of LNG

Skeena Watershed Coalition

In 2016, I collaborated with an employee of Skeena Watershed Coalition to produce a mini documentary video outlining the potential hazards of a proposed LNG development project near Prince Rupert, British Columbia. This project was the first time I used GIS data to create a custom 3D animation platform. The final animations in this video were also licensed for use by the Wild Salmon Centre. You can my work in Scientifically Flawed: Pacific Northwest LNG.

GIS Research Projects

As a student and independent artist, I have worked on an number of research projects that involved GIS data visualization and writing custom code to process data. Although the results of these projects have not been formalized, they have been used in professional art exhibitions. As GIS industries move towards Digital Twins and 3D visualization, I believe that animated data visualizations will become increasingly relevant.

3D Climate Data Processing and Visualization

Climate model data is often stored as netCDF files, which are difficult to view as time series in online applications. Writing custom software to import and process this data, I can produce compressed images that contain individual time steps for spatial data. These images can then be used with graphics shaders to visualize variables such as temperature, humidity and wind direction. Climate data is useful to increase the realism of 3D visualizations, as well as to convey critical information.

For an example of animated climate data, play this video:


Animated Wildfire Data Visualization

NASA operates VIIRS and MODIS satellites that detect anomalies associated with wildfire activity. This data is time-stamped and can be visualized to represent the spread of specific wildfires. As I have found the source vector data to be limiting in resolution, I have developed a method to create time-based raster data which can be used to seamlessly animate wildfire activity. Combined with data corresponding to the footprint of wildfires, engaging animations can be produced that depict wildfire activity.

For an example of animated wildfire data, play this video:


Student GIS Projects

As a student in GIS and Environmental Studies courses, I have completed various mapping projects. For assigned course work, I always tried to invest my time in topics that I am personally interested in, and generally exceed expectations for assigned work.

Data Extraction from LiDAR

GIS 502 Final Project

For my first GIS Analysis course, I wanted to push myself to learn LiDAR data processing in ArcGIS Pro. This storymap details how I used various tools to classify point cloud data to derive raster data for vegetation and impervious surfaces in an urban environment. Learning to work with LiDAR data was challenging, but I was successful in figuring out a process to classify various types of vegetation and differentiate between anthropocentric features.

Ecological Connectivity Maps

ES 240 Group Project

During a group project around opportunities to increase ecological connectivity, I produced a series of maps that depict ecosystems and anthropogenic impacts in the region around Victoria, BC. These maps were useful in our final report to suggest priority areas to establish wildlife migration corridors and key locations to construct wildlife crossings over regional highways.

Personal Mapping Projects

Since I have started learning GIS, I have worked on various maps relating to the areas in which I have lived. I use some of these maps while hiking, where a combination of aerial imagery, topo lines and property ownership is important for navigation. I have also produced maps for properties of family members, supporting permaculture and landscape planning. I export my work as PDF maps, where I can record new data in the field with my mobile device and update my master file.

Digital Art Projects

For the past 6 years, I have worked as a professional artist and independent computer graphics programmer. Although I am switching career paths towards more stable employment, my creative digital skills are highly applicable to GIS work. As an artist, I have a solid understanding of visual communication and media analysis. As a computer programmer, I understand technical aspects of computer graphics, digital file formats and I can innovate new software systems. Bellow are some of my professional artworks that are relevant to GIS and landscape visualization, you can click on each image to see more information about the project.

See my Visual Art Portfolio for more examples of my artwork.