Graphic Design Portfolio

Colton Hash

Artist Website:        www.coltonhash.com
Artist Instagram:    @colton.hash

Overview

I am a digital artist, educator and software developer with experience in public communication. I am seeking employment as a Graphic Designer to apply my diverse skills to a workplace that enhances public education and community engagement with history and contemporary issues. Most of my experience is in the context of visual art, but I have also completed professional contracts to produce animations, content for social media and printed materials.

GIS Analysis Microcredentials, Seneca Polytechnic, Toronto ON
Sept 2023 – March 2024

  • ArcGIS Pro vector and raster data analysis, LiDAR data processing.
  • ArcGIS Online tools, exporting for Web Maps and Story Maps.


Master of Fine Arts, Department of Visual Arts, University of Victoria, Victoria, BC
Sept 2020 – April 2022

  • Research focus in data visualization and interactive software development


B.Sc., Combined Computer Science and Visual Arts Major
Environmental Studies Minor, University of Victoria, Victoria, BC
Sept 2010 – April 2018

  • Digital Media Art, Photo, Video, User Interface Design
  • Computer Graphics, Database Systems, Networking, Software Engineering
  • Ecological Processes, Ethnoecology, Political Ecology, Systems Theory, Marine Science

Adobe Creative Suite

  • Photoshop, Illustrator, Indesign
  • After Effects, Premier Pro


Web Development

  • HTML, CSS, javascript
  • Google Earth Engine
  • WordPress with Elementor
  • three.js, WebGL


GIS Software

  • ArcGIS Pro, ArcGIS Online Tools
  • QGIS, Avenza
  • Exporting GIS data for web and interactive applications
  • Exporting maps for print and digital pdf maps for navigation


Computer Programming

  • C# with Unity
  • SQL, python, java


Microsoft 365 Suite

Google Online Tools

Freelance Design Projects

These data visualization projects were completed under freelance contracts to produce digital content for public dissemination. Each project involved accessing and composing various data sources for diverse digital platforms. With a background in creating interactive artworks and social media content for environmental advocacy organizations, I strive to create highly detailed graphics that are imapctful and informative.

Urban Watersheds

Engage with Nature Based Solutions

In 2023, I was commissioned to produce an artwork that engages the general public with nature based solutions to mitigate climate change. My final data visualization artwork, Urban Watersheds: Bowker Creek, integrated LiDAR data with municipal storm water system data to highlight how impervious surfaces contribute to polution. This interactive artwork was paired with Hydrosheds, a generative simulation that depicts how changes in urban surface conditions impact local waterways. You can learn more about these projects and the resulting public exhibition at Engage with Nature Based Solutions.

Engines of Change

Flux Media Gallery

In 2022, I was comissioned to create an Augmented Reality artwork that engages with place-based histories around Victoria, BC. Inspired by the history of railroads on Vancouver Island, I created an artwork that visualizes restored rail service along the abandoned Esquimalt and Nanaimo railway. This project integrated historical maps and photographs from the Victoria archives to situate viewers in a troubled history of colonization and land dispossession associated with the construction of this railway. You can view this project through the Revealing Presence augmented reality walking tour.

Ecosystem Map Animations

Endangered Ecosystem Alliance

In 2021, I was hired to produce a series of map animations depicting Bio Ecological Climate Zones for various ecosystems across Canada. Although these graphics are fairly simple, I wanted to show the complexity of forest cover and terrain, so I produced very high resolution images were animated with Adobe After Effects. You can see my work in the mini documentary videos by the Endangered Ecosystem Alliance.

Fractured Waves Exhibition

Artcite Inc.

In 2020, I was selected to produce a solo exhibition at Artcite Inc, an artist-run-centre in Windsor, Ontario. Due to COVID-19, the exhibition was shifted to an online format, which I wanted to use as an opportunity to experiment with interactive data visualization. The main artworks featured in this exhibition depict greenhouse gas emissions animated with climate model data for the Vancouver and Windsor regions. As viewers zoom into these artworks, they also see a visualization of AIS data to depict aquatic noise pollution. You can see an archived version of this virtual data art exhibition here.

Lelu Island Impacts of LNG

Skeena Watershed Coalition

In 2016, I collaborated with an employee of Skeena Watershed Coalition to produce a mini documentary video outlining the potential hazards of a proposed LNG development project near Prince Rupert, British Columbia. This project was the first time I used GIS data to create a custom 3D animation platform. The final animations in this video were also licensed for use by the Wild Salmon Centre. You can my work in Scientifically Flawed: Pacific Northwest LNG.

Interactive Mapping Projects

I am interested in using Geographic Information Systems to visualize landscape data and tell stories about ecological issues. I have taken classes in GIS analysis to learn advanced mapping features and to explore online presentations using ArcGIS Online tools.

Impact of the Pine Beetle Epidemic

During my second GIS Analysis course, I worked on a project to map the continued impact of the Mountain Pine Beetle Epidemic the South Helena National Forest. This interactive ArcGIS Experience includes various graphics so that viewers can better understand how GIS data can be used to study ecological change. Work for this project also included mapping historical mining features with LiDAR data.

Data Extraction from LiDAR

For my first GIS Analysis course, I wanted to push myself to learn LiDAR data processing in ArcGIS Pro. This storymap details how I used various tools to classify point cloud data to derive raster data for vegetation and impervious surfaces in an urban environment. Learning to work with LiDAR data was challenging, but I was successful in figuring out a process to classify various types of vegetation and differentiate between anthropocentric features.

Personal Design Projects

In addition to my professional work as a digital arts educator and free lance contractor, I have created many project that advance my technical skills. Bellow are some previews of additional maps, animated graphics, posters and photos that showcase my skills for media creation.

Digital Art Projects

For the past 6 years, I have worked as a professional artist and independent computer graphics programmer. Although I am switching career paths towards more stable employment, my creative digital skills are highly applicable to graphic design work. As an artist, I have a solid understanding of visual communication and media analysis. As a computer programmer, I understand technical aspects of computer graphics, digital file formats and I can innovate new software systems. Bellow are some of my professional artworks that are relevant to graphic design, you can click on each image to see more information about the project.

See my Visual Art Portfolio for more examples of my artwork.

Media Features and Publications

Below is a selection of media features and publications that include my writing and artwork.

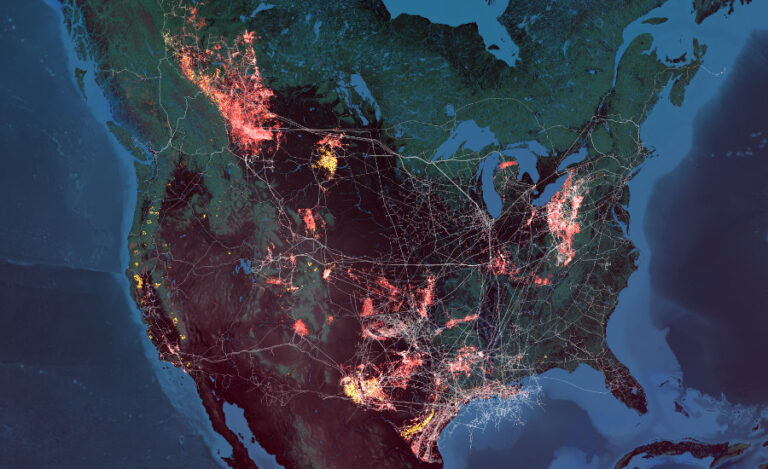
Visualizations from a Climate Youth

By Colton Hash, Millennium Alliance for Humanity and the Biosphere, Stanford University, January 2023.

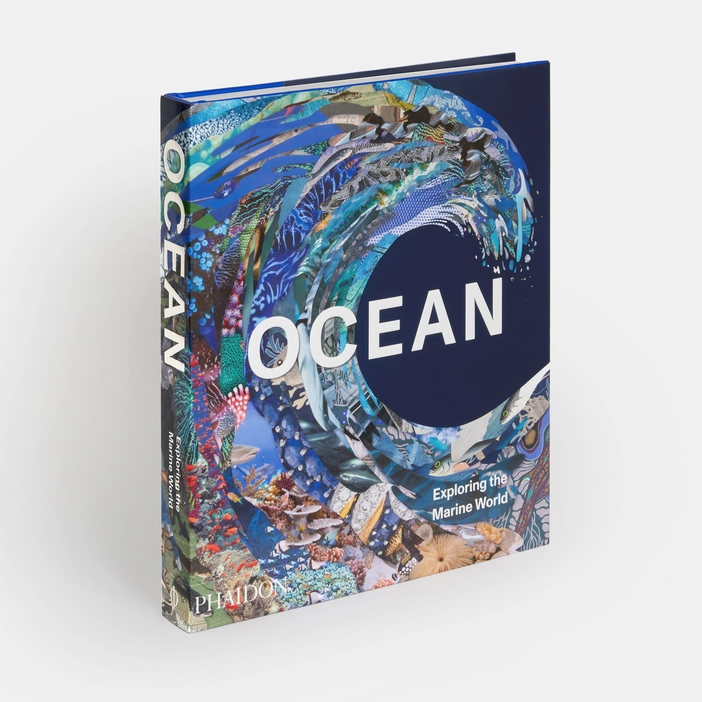
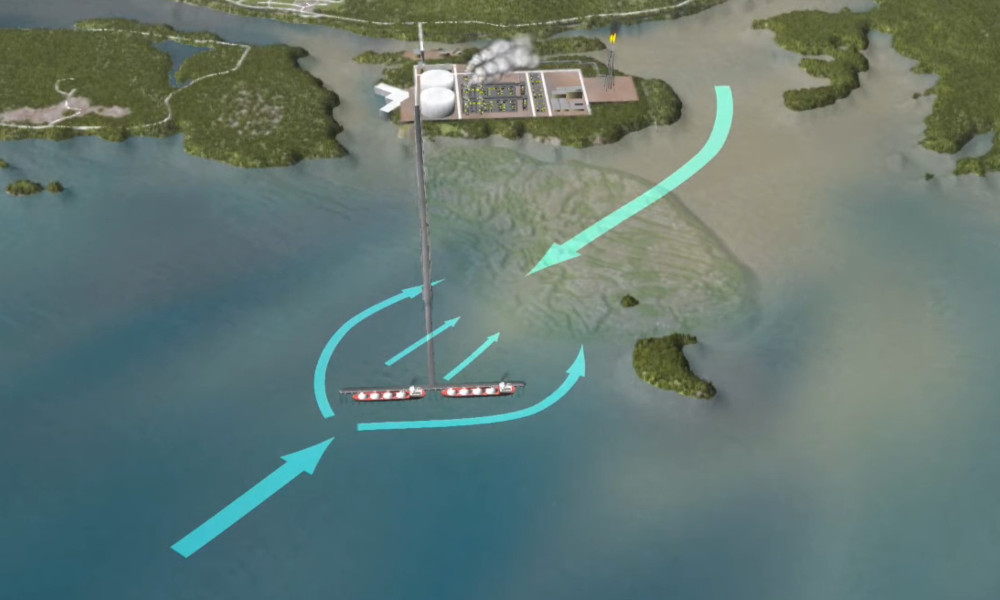
Ocean: Exploring the Marine World

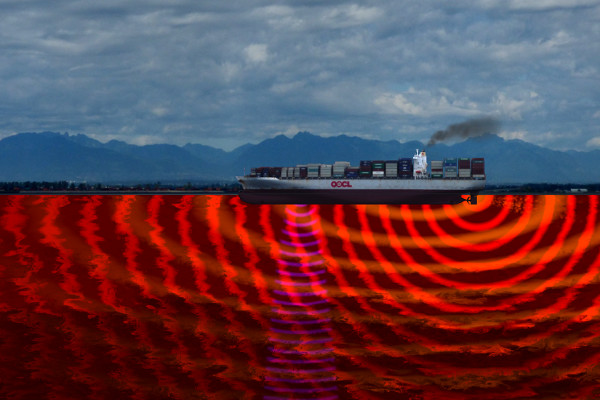
Phaidon, October 2022. Features image and writing about Acoustic Turbulence

Materiality, Interaction, and the Other: Colton Hash & Freya Olafson

By Stacey Cann, Luma Film & Media Art Quarterly, Summer 2021
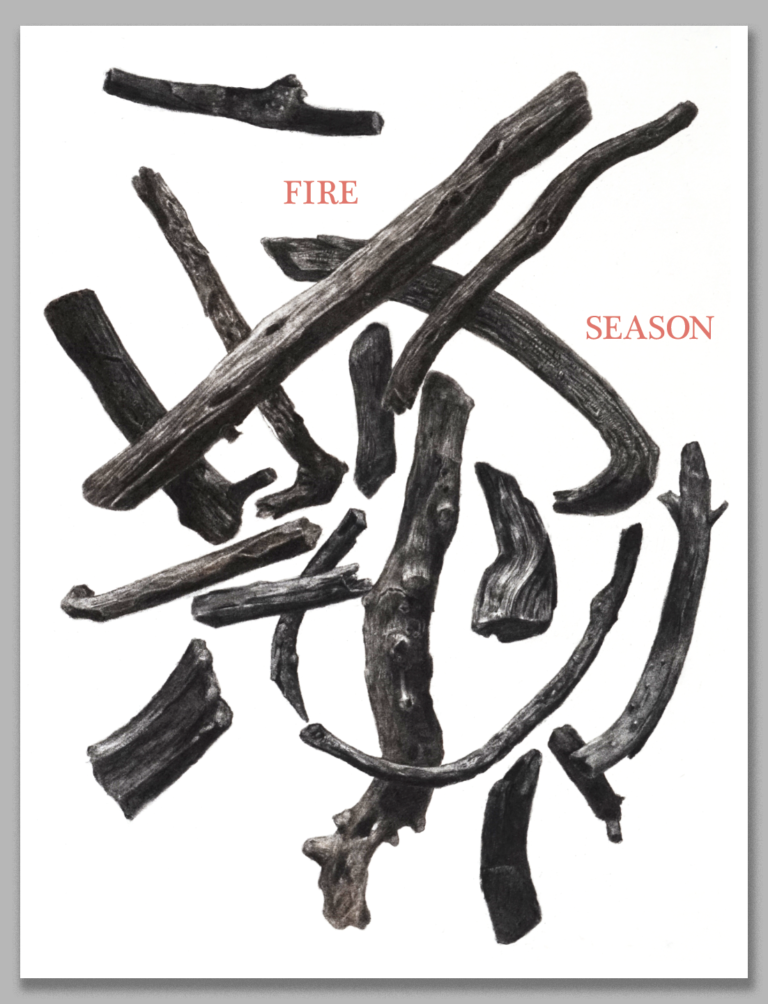
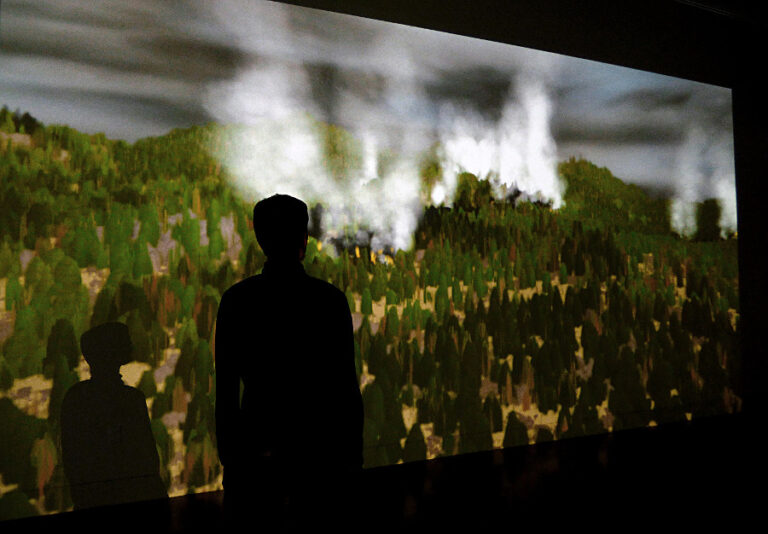
Fire Season

Fire Season, Issue 1, 2020. Includes images and writing for Homeostasis.

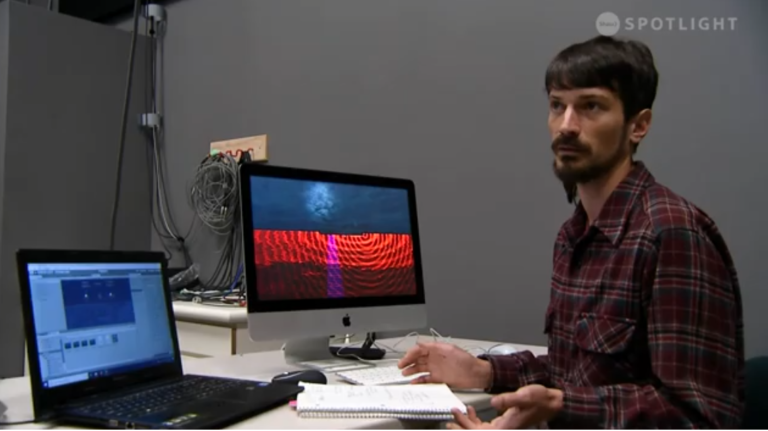
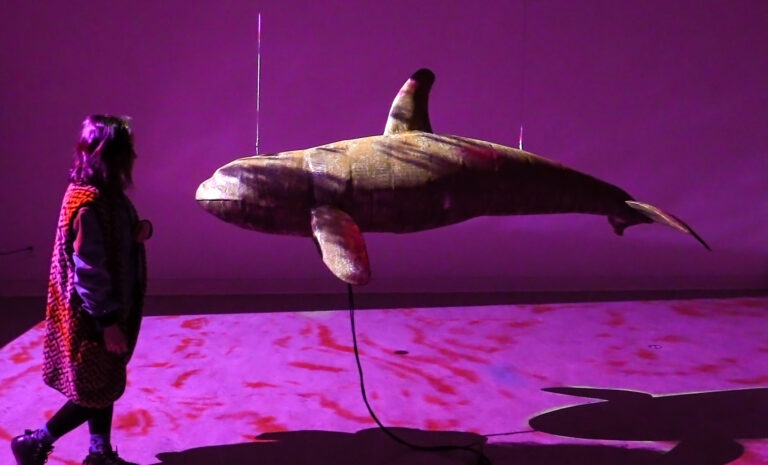
Resonant Disintegration (Shaw Spotlight)

By John Mackenzie, Shaw Spotlight Features, September 2019

Experience Ocean Data Through Interactive Art

Ocean Networks Canada, June 2019

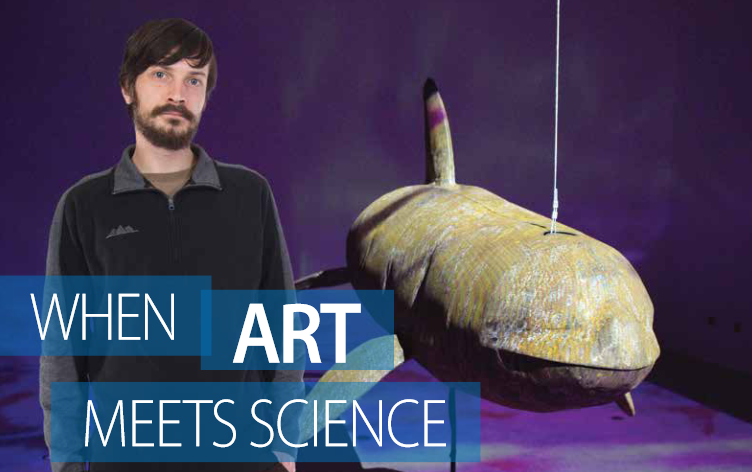
When Art Meets Science

By John Threlfall, UVic Knowledge, March 2018

Resonant Disintegration (Research Video)

By Colton Hash, University of Victoria Research Reals, March 2018