Carbon Pulse, 2021
Interactive Data Visualization
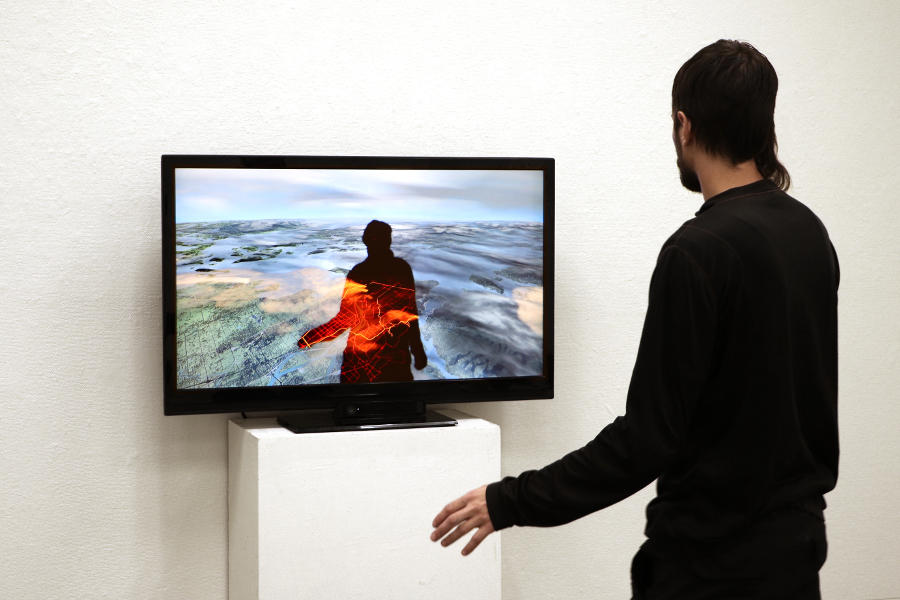
Carbon Pulse: The Salish Sea, Interactive projection
Project Description
Carbon Pulse is a series of interactive data visualizations artworks that depict greenhouse gas emissions from the urban regions. Historical climate model data is integrated into a virtual landscape to visualize weather patterns interacting with atmospheric pollutants. Gestural clouds, defined by provincial emissions data, emanate from industrial facilities. As viewers approach the display, their silhouette is recorded by a depth camera which is used to reveal regional infrastructure. This installation situates viewers in relation to local carbon emissions to foster personal reflection on climate change.
Data Sources: Environment Canada, US EPA, OpenStreetmap, NARR, SRTM